
During the first quarter of 2026, the best performing asset classes were U.S. small and large value stocks and international large value stocks. The following chart shows the 3-month, 1-year, and 30-year performance of many DFA funds (representing different asset classes) compared to the S&P 500 Index:
Market Returns for the period ending March 31, 2026
| DFA Fund / Index | 3 Month Return | 1 Year Return* | 30 Year Return* |
| S&P 500 Index | -4.33 | 17.80 | 10.00 |
| DFA World Core Equity | -0.03 | 23.22 | N/A |
| DFA U.S. Large Value | 4.08 | 18.41 | 9.59 |
| DFA U.S. Small | 2.63 | 20.31 | 9.76 |
| DFA U.S. Small Value | 6.84 | 26.13 | 10.86 |
| DFA Real Estate (REITs) | 3.33 | 2.48 | 9.21 |
| DFA Int’l Large | 2.62 | 27.93 | 6.09 |
| DFA Int’l Large Value | 5.83 | 38.20 | 7.35 |
| DFA International Small | 1.00 | 30.71 | N/A |
| DFA Int’l Small Value | 3.04 | 42.00 | 8.45 |
| DFA Emerging Markets Core | 3.65 | 34.65 | 7.01 |
| DFA 5-Year Global Bonds | 0.25 | 3.46 | 3.79 |
| DFA Inflation Protected Bonds | 0.36 | 2.90 | N/A |
*Note: Returns for periods greater than 1 year are annualized. Top 3 returns are in bold.
The first quarter of 2026 played out a lot like the start of 2025—stocks moved higher in January and February, only to give most of those gains back in March. This time, though, the headline risk was different. Geopolitical tensions with Iran escalated to the point where the Strait of Hormuz—through which roughly 20% of the world’s oil flows—was effectively shut down. Markets reacted quickly, with oil and gas prices spiking and inflation fears rising.
This quarter was another good reminder of why diversification still matters. Large U.S. tech companies dragged the S&P 500 down -4.34%* for the quarter, while the short-term bond market** was essentially flat. Fortunately, international large, emerging markets, U.S. small cap value, and U.S. large value stocks all posted gains, helping offset some of the decline of the S&P 500 index.
It’s only natural to wonder whether you should make changes to your portfolio during uncertain times—but the reality is, the stock market is never truly certain. Prices move every day as new information becomes available and markets adjust to reflect it. This volatility is the price of admission to receive the stock market’s long term return potential.
We’ve included a helpful visual from Vanguard showing that geopolitical sell-offs tend to be short-lived. On average, the S&P 500 has returned about +5% six months after a major geopolitical event, and roughly +8% after one year—right in line with its long-term average annual return.
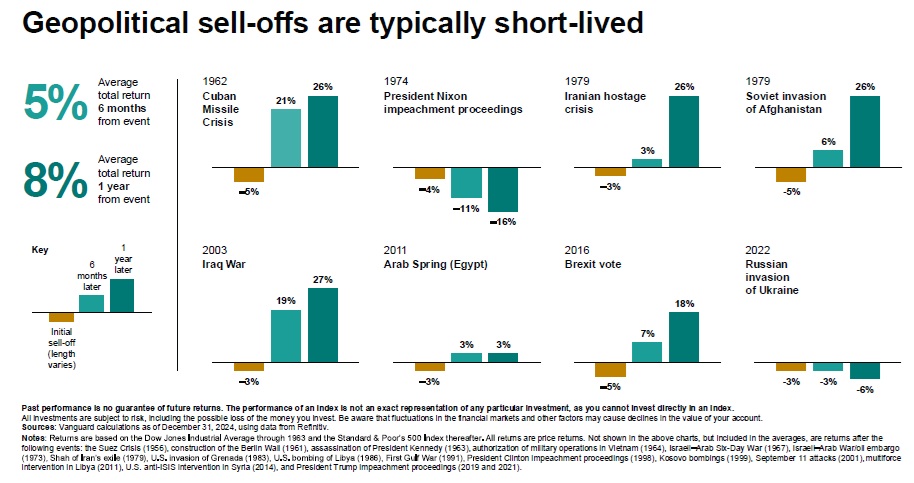
The key takeaway is that reacting to headlines is usually not a great investment strategy. Staying patient and disciplined is far more likely to lead to better long-term outcomes—and help avoid costly mistakes along the way.
Next, as you may have heard, we have been migrating our systems to a new software tool called Advyzon, which will replace several programs that we used for portfolio management, reporting, rebalancing portfolios, creating trades, and many other things. This has been a long process, and this is the first quarter you will see our new quarterly reports. Overall, they have the same layout as the old ones, but there are few differences that I want to address.
The Activity Summary will now show your “beginning market value” since inception as $0 (in most cases), and this beginning value will be included as part of “net transfers” and/or “contributions.” There are some differences with how Advyzon software handles net transfers (previously called “merge in/out”), contributions, distributions, and “domestic taxes withheld,” which are shown separately from distributions (like how I handle my fees). I want to assure you that I have reviewed every client report, and the numbers all reconcile with prior reports. Advyzon has some differences in how it categorizes transactions (compared to our prior software), and I really like the changes and feel they are an improvement. I checked the “total gain/loss” (previously called “market value increase/decrease”) for every client and can confirm that it reconciled to prior reports.
The Performance Summary section does not show YTD (year to date) or the 5-year returns, as it used to, due to space constraints. Finally, the last section that shows the fee calculation is much more detailed and shows every account in the summary section, as well as which accounts pay their own fee or if it is paid by a different account. Overall, I’m quite happy with the new layout and I hope you like it! Please feel free to reach out if you have any questions about these changes.
Finally, it’s that time of the year where we try to complete our tax returns before the April 15th deadline. Please provide us with a copy of your entire federal and state tax return upon completion or remind your tax person to do so.
Now, in order to comply with the provisions of the Gramm-Leach-Bliley Act, SWM’s Privacy Statement is available here for your review. The Privacy Act requires that we deliver this to every client on an annual basis. Also, the most current version of Form CRS is available on our website or by clicking this link: Form CRS. Our most recent ADV Part 2 is available for you review by clicking this link: ADV Part 2.
We greatly appreciate the trust you have placed in us to help guide you forward. Feel free to reach out if you need anything.
Warmly,

*As measured by Vanguard 500 Index Fund (VFIAX)
**As measured by DFA 5-Year Global Fixed Income Portfolio (DFGBX)
About Christopher Jones

Christopher Jones is the Founder and President of Sparrow Wealth Management, a fee-only financial planning and investment management firm. Before entering the investment field, Chris was a management consultant for Deloitte Monitor. He graduated summa cum laude from Brigham Young University with a B.S. in Economics and a minor in Business Management.